What does cash-on-cash return actually mean?
Cash-on-cash return is the most important metric for rental investors. Learn what it measures, how to calculate it, and what numbers to aim for in 2026.

Your rental property made $5,000 this year. Is that good or bad?
The answer is: it depends on how much you invested to get that $5,000.
If you invested $100,000, that is a 5% return. If you invested $50,000, that is a 10% return. Same cash flow, very different results.
Cash-on-cash return measures your annual cash profit as a percentage of the cash you invested. It is the most important metric for understanding whether a rental property is actually delivering good returns.
The formula
Cash-on-cash return is simple to calculate:
Cash-on-Cash Return = Annual Cash Flow ÷ Total Cash Invested × 100
Annual cash flow is the money left over after paying all expenses and the mortgage. It is what actually hits your bank account each year.
Total cash invested is all the cash you put into the deal. This includes:
- Down payment
- Closing costs
- Initial repairs or improvements
- Any other cash spent to acquire and prepare the property
A simple example
You buy a rental property:
- Purchase price: $200,000
- Down payment (25%): $50,000
- Closing costs: $6,000
- Initial repairs: $4,000
- Total cash invested: $60,000
After a year of renting:
- Monthly rent collected: $1,800
- Monthly expenses (taxes, insurance, maintenance, vacancy): $400
- Monthly mortgage payment (P&I at 6.2%): $920
- Monthly cash flow: $480
- Annual cash flow: $5,760
Cash-on-cash return: $5,760 ÷ $60,000 = 9.6%
For every dollar you invested, you are getting about 9.6 cents back each year in cash.
Why cash-on-cash matters more than total cash flow
New investors often focus on monthly cash flow: "This property makes $400/month!" But that number alone does not tell you if the investment is efficient.
Consider two properties:
Property A:
- Monthly cash flow: $300
- Total cash invested: $40,000
- Cash-on-cash return: 9%
Property B:
- Monthly cash flow: $400
- Total cash invested: $80,000
- Cash-on-cash return: 6%
Property B has higher cash flow, but Property A is a better use of your capital. With $80,000, you could buy two Property A deals and earn $600/month with an average 9% return. Or you could buy one Property B and earn $400/month at 6%.
Cash-on-cash return helps you compare deals and allocate capital efficiently.
Real-world comparison: Using CrescoRealty to analyze two deals
Let's walk through how CrescoRealty calculates cash-on-cash return for two realistic 2026 scenarios. Both properties are in the same market, but the financing and numbers differ significantly.
Scenario 1: Midwest rental with tight margins
Property details:
- Address: 142 Oak Street, Columbus, OH
- Purchase price: $200,000
- Monthly rent: $1,800
- 3 bed / 2 bath single-family
Investment inputs:
- Down payment: 25% ($50,000)
- Interest rate: 6.2% (30-year fixed)
- Closing costs: $6,000 (3%)
- Property taxes: 1.5% annually ($250/month)
- Insurance: $130/month
- Vacancy allowance: 5%
- Property management: 10% of rent ($180/month)
- Maintenance reserve: $100/month
How CrescoRealty calculates it:
First, the app calculates your monthly mortgage payment:
- Loan amount: $150,000
- Monthly P&I: $920
Then total monthly expenses:
- P&I: $920
- Taxes: $250
- Insurance: $130
- Property management: $180
- Maintenance: $100
- Total monthly expenses: $1,580
Cash flow calculation:
- Gross rent: $1,800
- Effective rent (after 5% vacancy): $1,710
- Cash flow: $1,710 - $1,580 = $130/month
- Annual cash flow: $1,560
Cash-on-cash return:
- Total cash invested: $50,000 + $6,000 = $56,000
- CoC ROI: $1,560 ÷ $56,000 = 2.8%
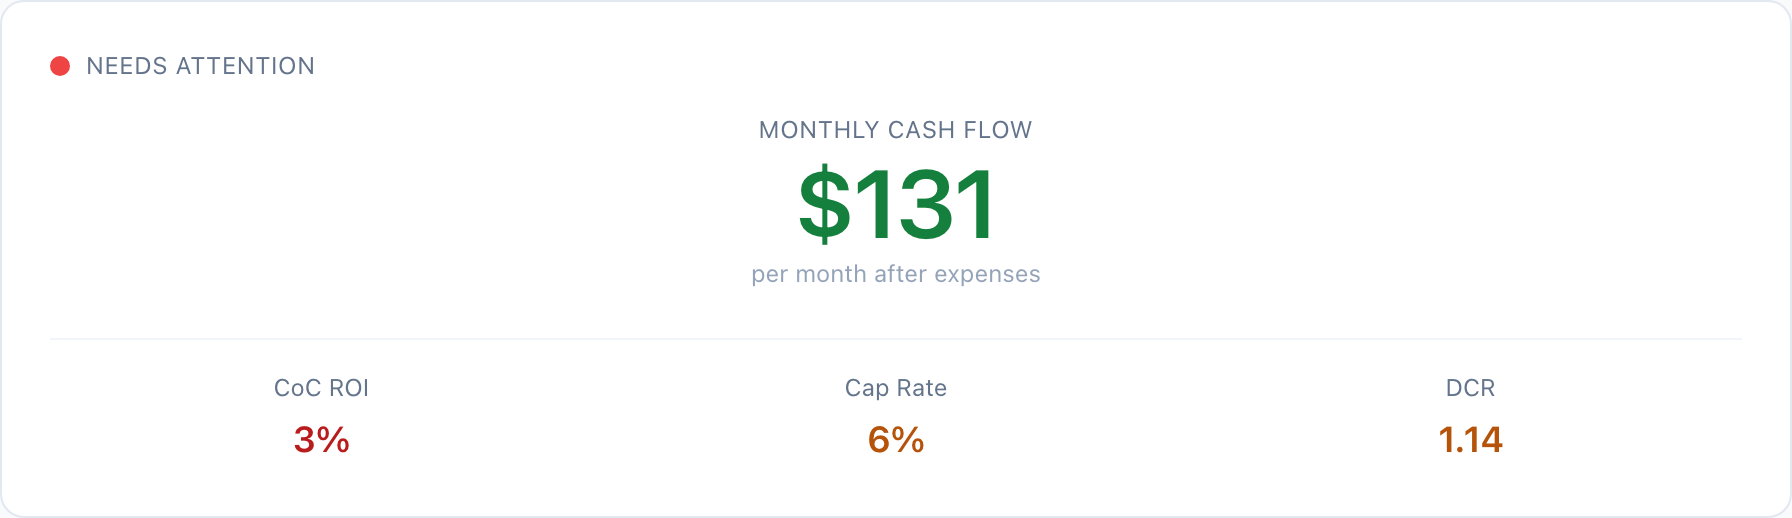
The screenshot shows CrescoRealty's analysis of this property. The app flags it as "Needs Attention" because while the cash flow is positive, the return on invested capital is modest at under 3%. The cap rate indicates the property has decent income potential, but financing costs eat into returns. The DCR shows the property covers its debt, but without much cushion.
Scenario 2: Better rent-to-price ratio changes everything
What if you found a property with better fundamentals? Let's look at a duplex in the same market:
Property details:
- Address: 87 Riverside Drive, Columbus, OH
- Purchase price: $285,000
- Monthly rent: $2,800 (both units combined, $1,400 each)
- 2 bed / 1 bath duplex
Investment inputs:
- Down payment: 25% ($71,250)
- Interest rate: 6.2% (30-year fixed)
- Closing costs: $8,550 (3%)
- Property taxes: 1.5% annually ($356/month)
- Insurance: $165/month
- Vacancy allowance: 5%
- Property management: 10% of rent ($280/month)
- Maintenance reserve: $150/month
CrescoRealty calculation:
Monthly mortgage payment:
- Loan amount: $213,750
- Monthly P&I: $1,310
Total monthly expenses:
- P&I: $1,310
- Taxes: $356
- Insurance: $165
- Property management: $280
- Maintenance: $150
- Total monthly expenses: $2,261
Cash flow calculation:
- Gross rent: $2,800
- Effective rent (after 5% vacancy): $2,660
- Cash flow: $2,660 - $2,261 = $399/month
- Annual cash flow: $4,788
Cash-on-cash return:
- Total cash invested: $71,250 + $8,550 = $79,800
- CoC ROI: $4,788 ÷ $79,800 = 6.0%
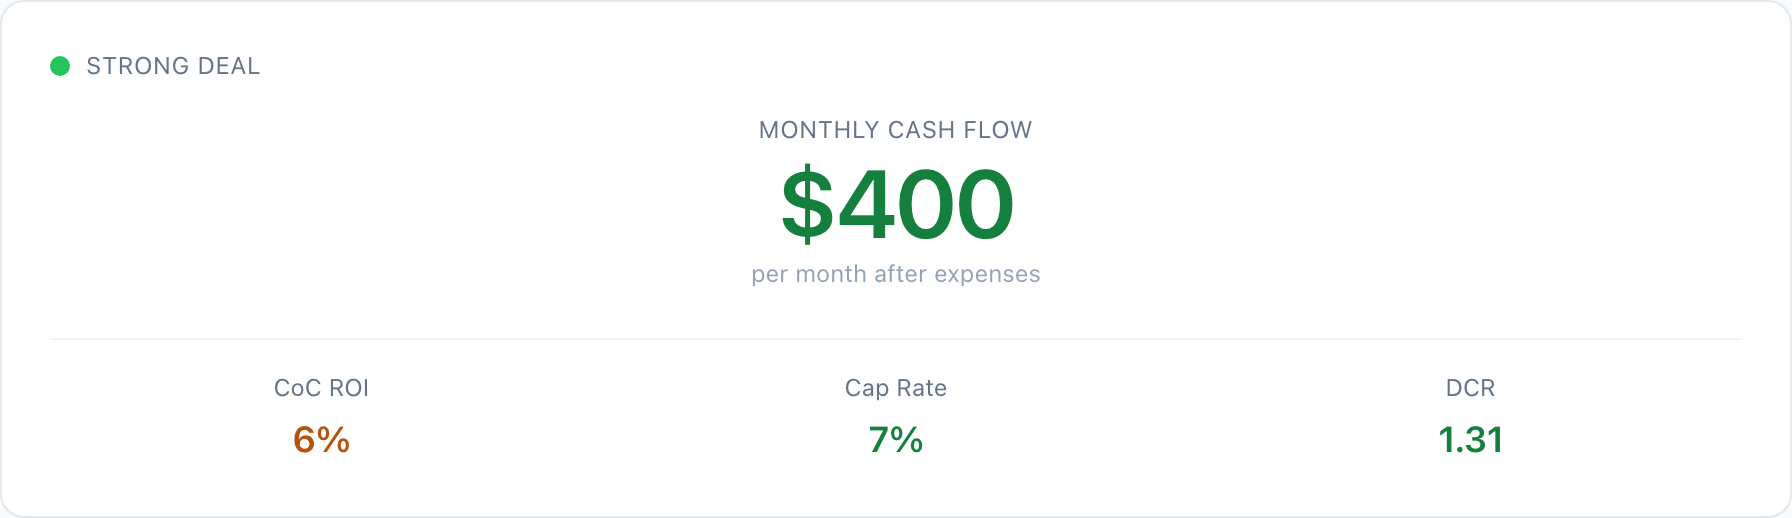
This duplex has a rent-to-price ratio of 0.98% ($2,800 / $285,000), compared to 0.9% for Scenario 1. That difference—along with better rent stacking from two units—more than doubles your return despite investing more capital.
The lesson: Small differences in rent-to-price ratio create meaningful differences in cash-on-cash return. The 3% CoC property and the 6% CoC property are in the same market. The difference is finding properties where the numbers actually work.
What is a good cash-on-cash return in 2026?
Target returns depend on your goals, risk tolerance, and market conditions. Here are general benchmarks based on current market conditions:
| Return | Interpretation |
|---|---|
| 10%+ | Excellent return, increasingly rare at current rates |
| 8-10% | Strong return, achievable in select markets |
| 6-8% | Solid return, common range in early 2026 |
| 4-6% | Modest return, may rely more on appreciation |
| Below 4% | Weak cash return, needs strong appreciation to justify |
Current market context (February 2026): Mortgage rates have stabilized in the 6.0-6.3% range for 30-year fixed loans, down from highs near 7% in late 2024. This has improved cash-on-cash returns compared to 2024, though deals that would have delivered 10%+ at 4% rates now typically fall in the 6-8% range.
A 6-8% cash-on-cash return from a rental property comes with benefits beyond the cash return: equity building through mortgage paydown, tax advantages from depreciation, and potential appreciation. Compare the complete picture to alternatives like index funds or high-yield savings accounts.
Cash-on-cash vs. other return metrics
Cash-on-cash return is not the only metric that matters. Here is how it compares to related measurements.
Cash-on-cash vs. Cap Rate
Cap rate measures the property's return as if you paid all cash. It is calculated as net operating income divided by purchase price.
Cap rate tells you about the property's income potential regardless of financing.
Cash-on-cash tells you about your actual return based on how you financed it.
A property with a 6% cap rate might have an 8% cash-on-cash return if you use favorable financing, because leverage amplifies returns. Or it might have a 4% cash-on-cash return if the financing terms are unfavorable.
Use cap rate to compare properties objectively. Use cash-on-cash to evaluate your specific deal structure.
Cash-on-cash vs. Total ROI
Cash-on-cash only measures the cash you receive each year. It does not include:
- Equity building through mortgage paydown
- Property appreciation
- Tax benefits from depreciation
Total ROI or IRR (Internal Rate of Return) accounts for all of these. A property with 7% cash-on-cash might have 14% total ROI when you include equity building and appreciation.
CrescoRealty calculates both metrics automatically, so you can see immediate cash return alongside your complete wealth-building picture.
Cash-on-cash vs. ROE (Return on Equity)
Return on equity measures your return against your current equity in the property, not your original investment.
As you pay down the mortgage and the property appreciates, your equity grows. A property might have:
- Year 1: $52,000 equity, 7% cash-on-cash
- Year 5: $95,000 equity, 3.8% return on equity (same cash flow, more equity)
ROE helps you decide when to refinance, sell, or redeploy capital. Cash-on-cash helps you evaluate the initial investment.
How to improve cash-on-cash return
If a deal does not hit your target return, here are ways to improve it:
1. Negotiate a lower purchase price
Lower price means smaller down payment and loan amount. Both reduce cash invested and improve returns.
A $10,000 price reduction on a $200,000 property means:
- $2,500 less in down payment (at 25% down)
- $46 less in monthly P&I (at 6.2%)
- $552 more in annual cash flow
- Approximately 1% improvement in cash-on-cash return
2. Find properties with higher rents relative to price
Different markets and property types have different rent-to-price ratios. Small multifamily (2-4 units) often has better rent stacking than single-family. Some Midwest and Southeast markets have better ratios than coastal cities.
The duplex in Scenario 2 achieves a 0.98% rent-to-price ratio ($2,800 / $285,000), which delivers 6% cash-on-cash. The single-family in Scenario 1 at 0.9% ($1,800 / $200,000) only manages 3% CoC—that small difference in rent ratio doubles your return.
3. Reduce initial cash outlay
Can you negotiate seller credits toward closing costs? Can you minimize initial repairs by buying a property in better condition? Can you put down less money (though this increases your mortgage payment)?
Every dollar you remove from "total cash invested" improves your cash-on-cash percentage.
4. House hack
If you live in one unit of a multifamily property, you might qualify for primary residence financing with lower down payment requirements (3.5% FHA vs. 25% investment). This dramatically improves cash-on-cash by reducing cash invested.
Example: The Scenario 2 duplex with 3.5% FHA down:
- Down payment: $9,975 (vs. $71,250)
- Total cash invested: ~$18,525 (vs. $79,800)
- Even with higher payment from PMI, the dramatically lower cash invested boosts CoC return
The tradeoff: higher monthly payment due to larger loan and PMI.
5. Use the BRRRR strategy
Buy, Rehab, Rent, Refinance, Repeat. If you can force appreciation through improvements and refinance to recover your capital, your effective cash invested drops. A property where you recover 80% of your initial investment has much higher cash-on-cash on the remaining cash.
Common mistakes with cash-on-cash calculations
Forgetting closing costs
Down payment is not your only cash outlay. Closing costs typically add 2-5% of purchase price. A $200,000 property with $50,000 down might have $56,000+ total cash invested.
Ignoring initial repairs
If you spend $10,000 on repairs before renting, that is cash invested. Include it in your calculation.
Using gross rent instead of actual cash flow
Cash-on-cash uses net cash flow after all expenses and mortgage. Using gross rent gives you an unrealistically high number.
Not accounting for vacancy
If you assume 100% occupancy, your projected cash flow is too high. Use realistic vacancy assumptions (typically 5-8% for residential properties).
Comparing leveraged to unleveraged returns
A 12% cash-on-cash return with 80% leverage is not directly comparable to an 8% return from an all-cash purchase. Leverage amplifies returns but also amplifies risk.
Using cash-on-cash in your analysis workflow
Here is how cash-on-cash fits into property analysis:
-
Quick screening: Use rough estimates to filter properties. If a deal cannot possibly hit 5% cash-on-cash, move on.
-
Detailed analysis: For promising properties, calculate precise cash-on-cash using actual numbers for expenses, taxes, insurance, and financing terms.
-
Comparison: Compare cash-on-cash across multiple properties to find the best use of your capital.
-
Decision making: Combine cash-on-cash with other factors (location, condition, appreciation potential, management intensity) to make final decisions.
CrescoRealty calculates cash-on-cash automatically based on the numbers you enter. You see the result instantly alongside cap rate, DCR, and other key metrics, making it easy to screen properties quickly and compare deals accurately.
Key takeaways
-
Cash-on-cash return measures your annual cash profit divided by total cash invested. It tells you how efficiently your money is working.
-
Higher cash flow does not always mean better returns. A deal with lower cash flow but less cash invested might have higher cash-on-cash.
-
Target 6-10% in early 2026 markets. With rates around 6.2%, solid deals fall in this range. Expect 8-10% in investor-friendly markets with good rent ratios.
-
Cash-on-cash is not total return. It excludes equity building, appreciation, and tax benefits. Consider the complete picture.
-
Improve returns through: lower purchase price, better rent ratios, reduced cash outlay, house hacking, or BRRRR strategy.
Calculate your cash-on-cash return
Stop guessing whether a deal delivers good returns. Enter your numbers and see cash-on-cash calculated instantly alongside cap rate, IRR, and all the metrics that matter.
Get started free and analyze your first property in under 60 seconds.